
The Production Possibility Model (PPM)
is typically presented in a table and graph. A Production Possibility Curve (PPC) is a curve that measures the maximum combination of outputs that can be obtained from a given number of inputs (factors of production). For an economy to increase the quantity of one good produced, the production of another good must be sacrificed. This concept is known as opportunity cost.
A PPC is created from a production possibility table by mapping the data in a two-dimensional graph.
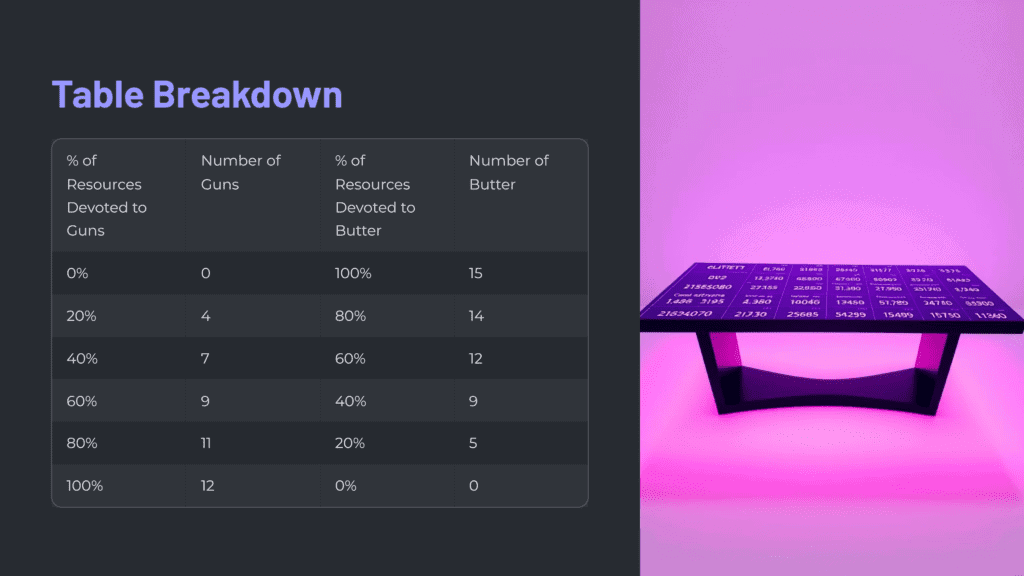
Example: A Production Possibility Table for Guns and Butter
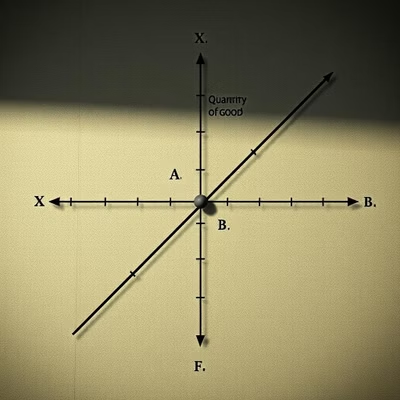
This table is then graphed to create the Production Possibility Curve (PPC):
On the graph:
Guns (x-axis) represent one good.
Butter (y-axis) represents the other.
The curve is typically bowed outward because some resources are better suited for producing certain goods than others. This demonstrates the concept of Efficiency.
Key Points on the PPC:
All points on the PPC (such as A, B, C, D, E) represent combinations of guns and butter that can be produced with the best use of resources.
All points inside the PPC (such as F) represent inefficient production.
At point F, the economy is not using all of its available resources, resulting in less production than possible.
All points outside the curve represent combinations that are unattainable given current resources and technology (unless more resources become available, like through technological innovation or additional workers).
The curve shows the trade-offs between two goods, highlighting opportunity cost.
Example: If a country is producing at point C (4 guns, 5 butter), moving to point D (5 guns, 3 butter) requires sacrificing 2 units of butter to produce 1 additional unit of guns. The opportunity cost of producing more guns is the lost production of butter.
Efficiency and Technological Change 🌟
Efficiency: Points on the PPC indicate the most efficient use of resources.
Technological Change: An outward shift of the PPC results from growth in the availability of inputs (such as capital or labor) or technological progress.
Example: If a country develops new farming technology, it could produce more butter without sacrificing the production of guns, leading to an outward shift of the PPC (like moving from point A to point G on an extended curve).
The Opportunity Cost
The opportunity cost is the benefit that you might have gained from choosing the next best alternative.
A decision to satisfy one set of wants means sacrificing another set. This sacrifice is called the opportunity cost.
The Role of Opportunity Cost
Opportunity cost helps us see the true cost of decision-making, which implies weighing different choices.
Opportunity Cost Formula:
Opportunity cost = What you sacrifice / What you gain
Example: If a farmer can either grow wheat or corn, and they choose to grow wheat, the opportunity cost is the amount of corn they could have grown. 🌽 vs. 🌾